MacBooks, Apple Neural Engine, and overheating 🔥
Newer MacBooks can heat up fast when you turn the camera on. Here is how I measured it second-by-second with macmon, InfluxDB, and Grafana, and what Apple Neural Engine (ANE) had to do with it.


I'm on X/Twitter at@CostasAlexoglou
Contents#
Intro#
We want Hopp to be the best open-source remote pair programming app for developers. A few things must be true:
- It must feel instant (target:
<100mslatency) - It must stay lightweight (so you can run Docker, open Android Studio, and keep Slack open without the app getting in the way)
- It must not cook your laptop during a long pairing session
Recently we got a report about a performance regression on macOS M-series (thanks Markus 🙏): the fans would go haywire. I had seen the same thing a few times during screen sharing.
In this post I will show how I debugged it on my own machine with Grafana and InfluxDB, and how I pinned down the pattern.
If you are in a hurry, the TL;DR is: on MacBook Pro M3 and M4 (I have not validated older M-series), turning the camera on can drive up GPU usage and temperatures, and the Apple Neural Engine (ANE) tracks that spike 🔥
Suspects#
Before diving into the issue, we started eliminating possible causes, kind of Reductio ad absurdum.
Suspect 1 - AV1 Encoder#
The first suspect was a new encoder we had introduced: AV1. In our previous post, we compared screen sharing encoders and AV1 looked great on paper.
We reverted the change and tested again. The overheating still showed up, so AV1 was off the suspect list.
Suspect 2 - Vibrancy#
Another thing we found was Vibrancy. It can increase WindowServer usage, and GPU usage is a quick path to higher temperatures.

Many people recommend turning on Reduce Transparency in macOS settings for better performance. We tested this and ended up removing vibrancy from our app.
Power consumption went down, which was good news. The overheating still happened on some MacBooks.
Test setup#
By day I work at Grafana Labs. On nights and weekends I maintain Hopp. I asked myself: why not measure my MacBook, second-by-second, and see exactly what changes when the fans start screaming?
To figure out what was happening, I set up:
- Run a Bun script that collects metrics once per second via macmon
- Send the time series to InfluxDB
- Perform a few actions inside Hopp
- Visualize everything in Grafana and look for the trigger
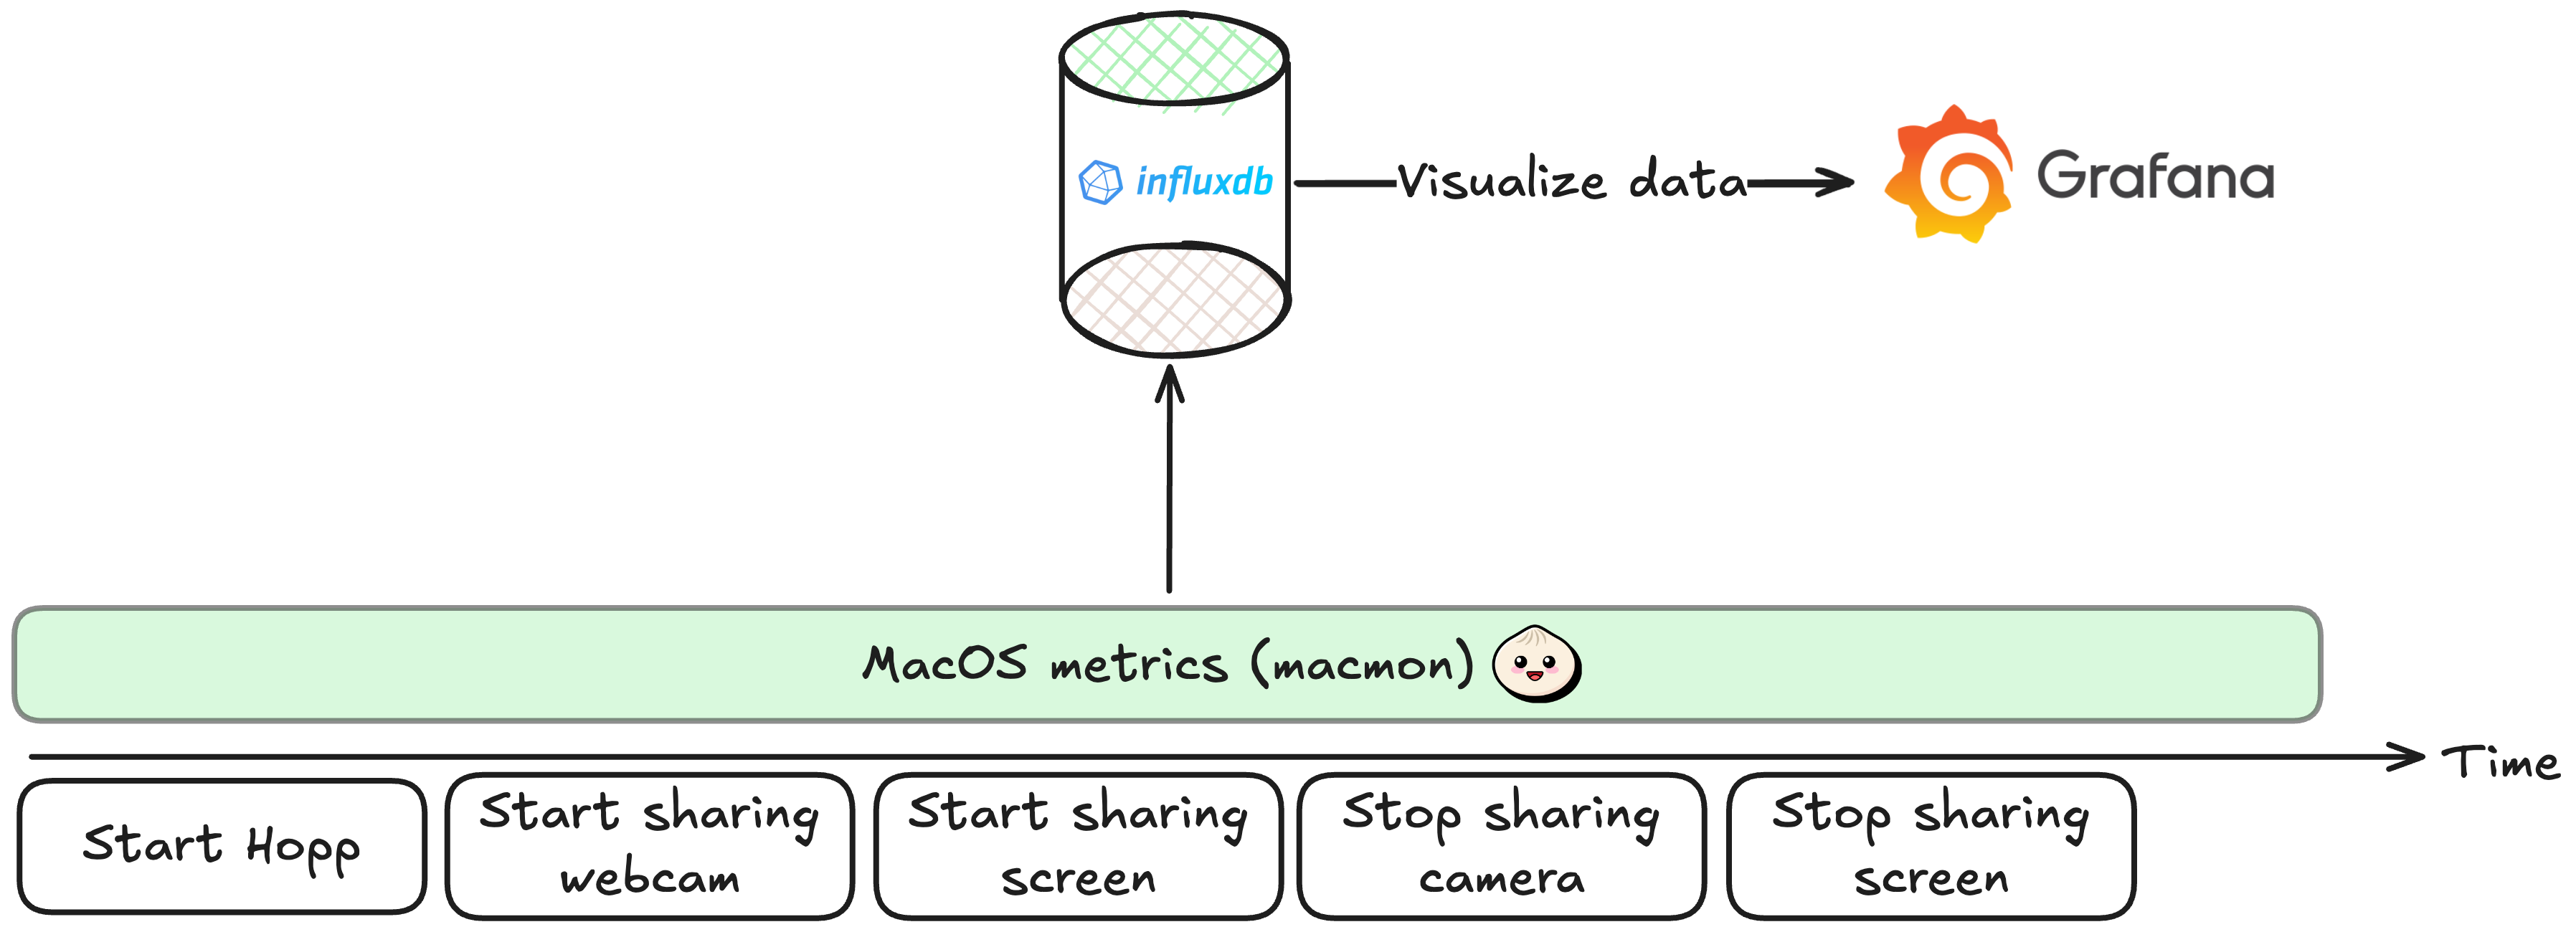
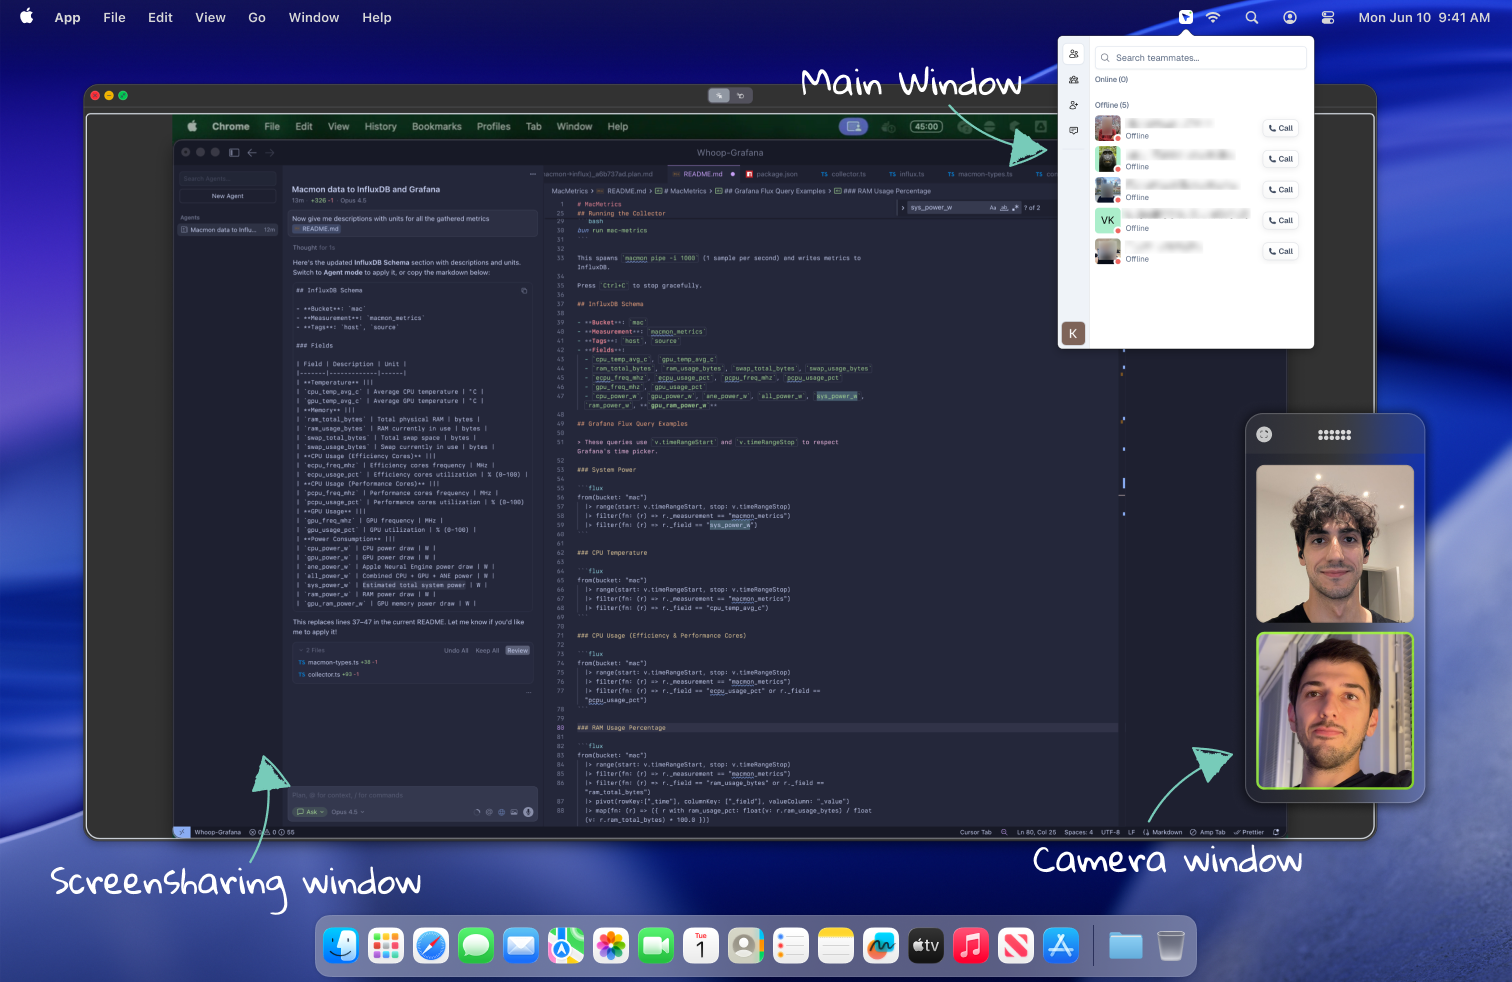
To make the actions concrete, here is an example of what I did inside Hopp. The most hardware-intensive operations are screen sharing and camera sharing.
Findings#
I ran the test a few times to confirm the pattern. The same curve showed up every time.
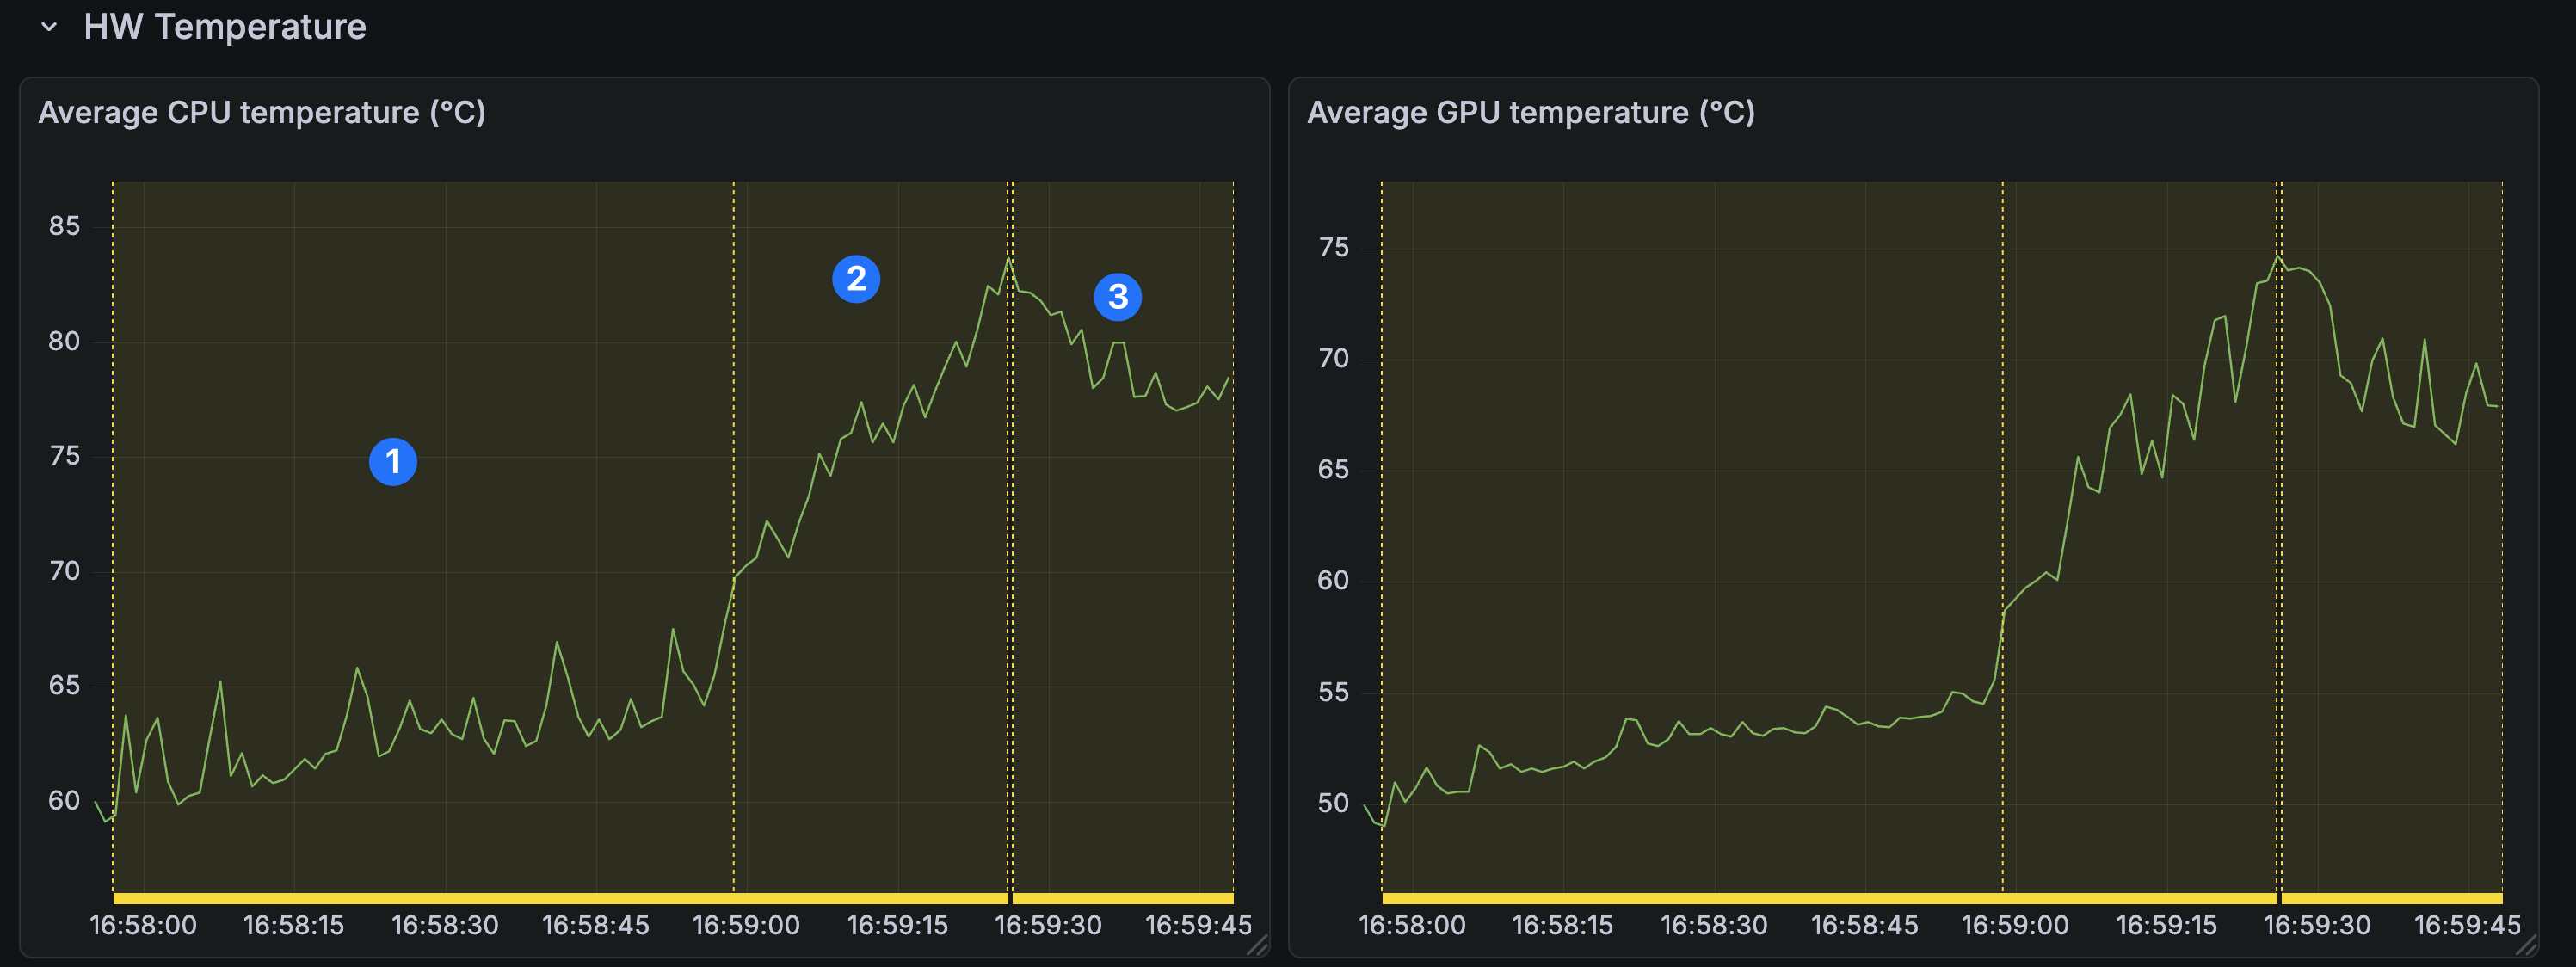
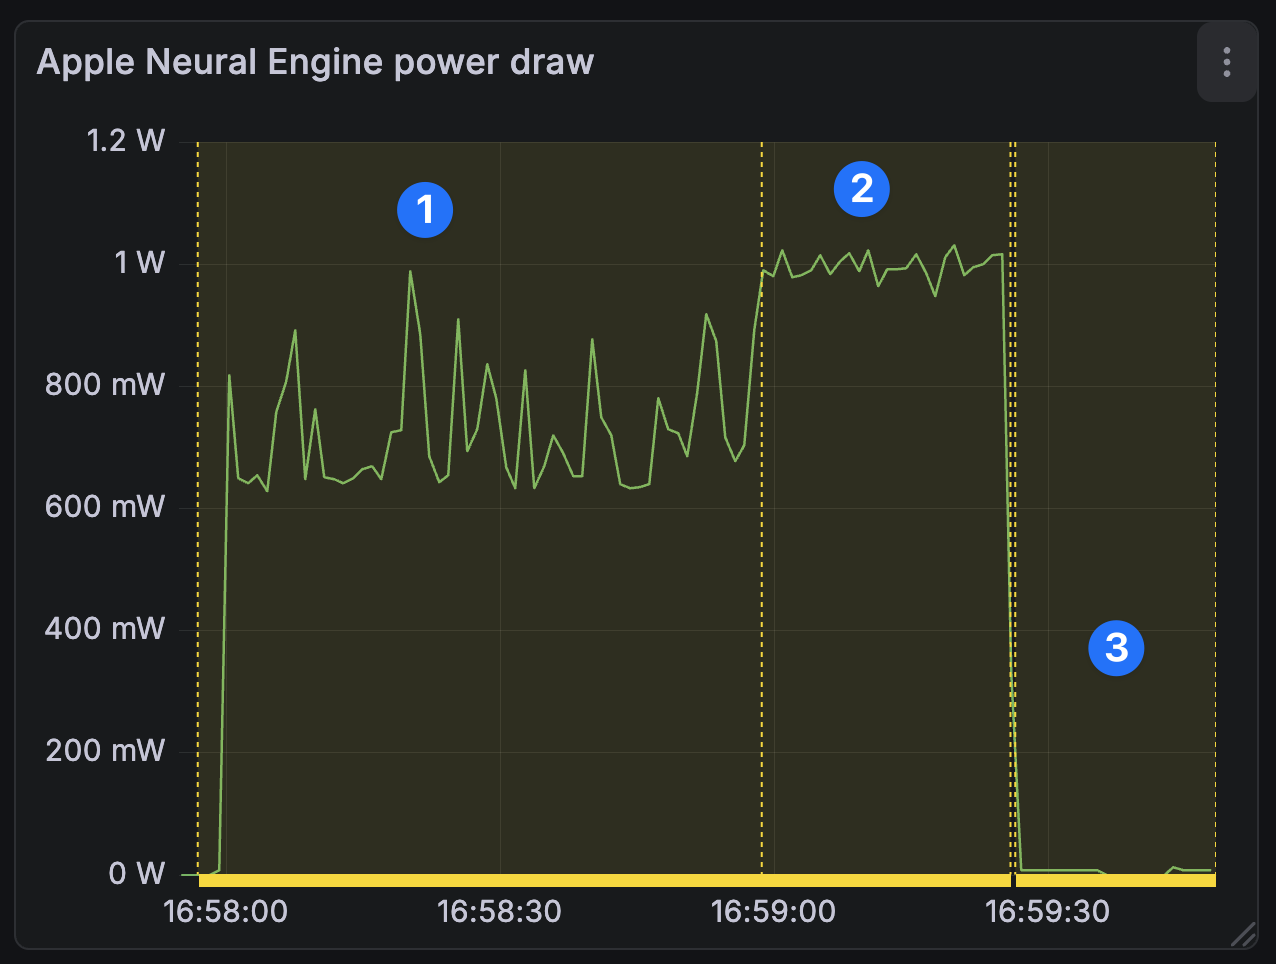
In the following graphs
- #1 is just audio call.
- #2 is screen sharing and camera enabled.
- #3 is camera disabled screen sharing enabled.
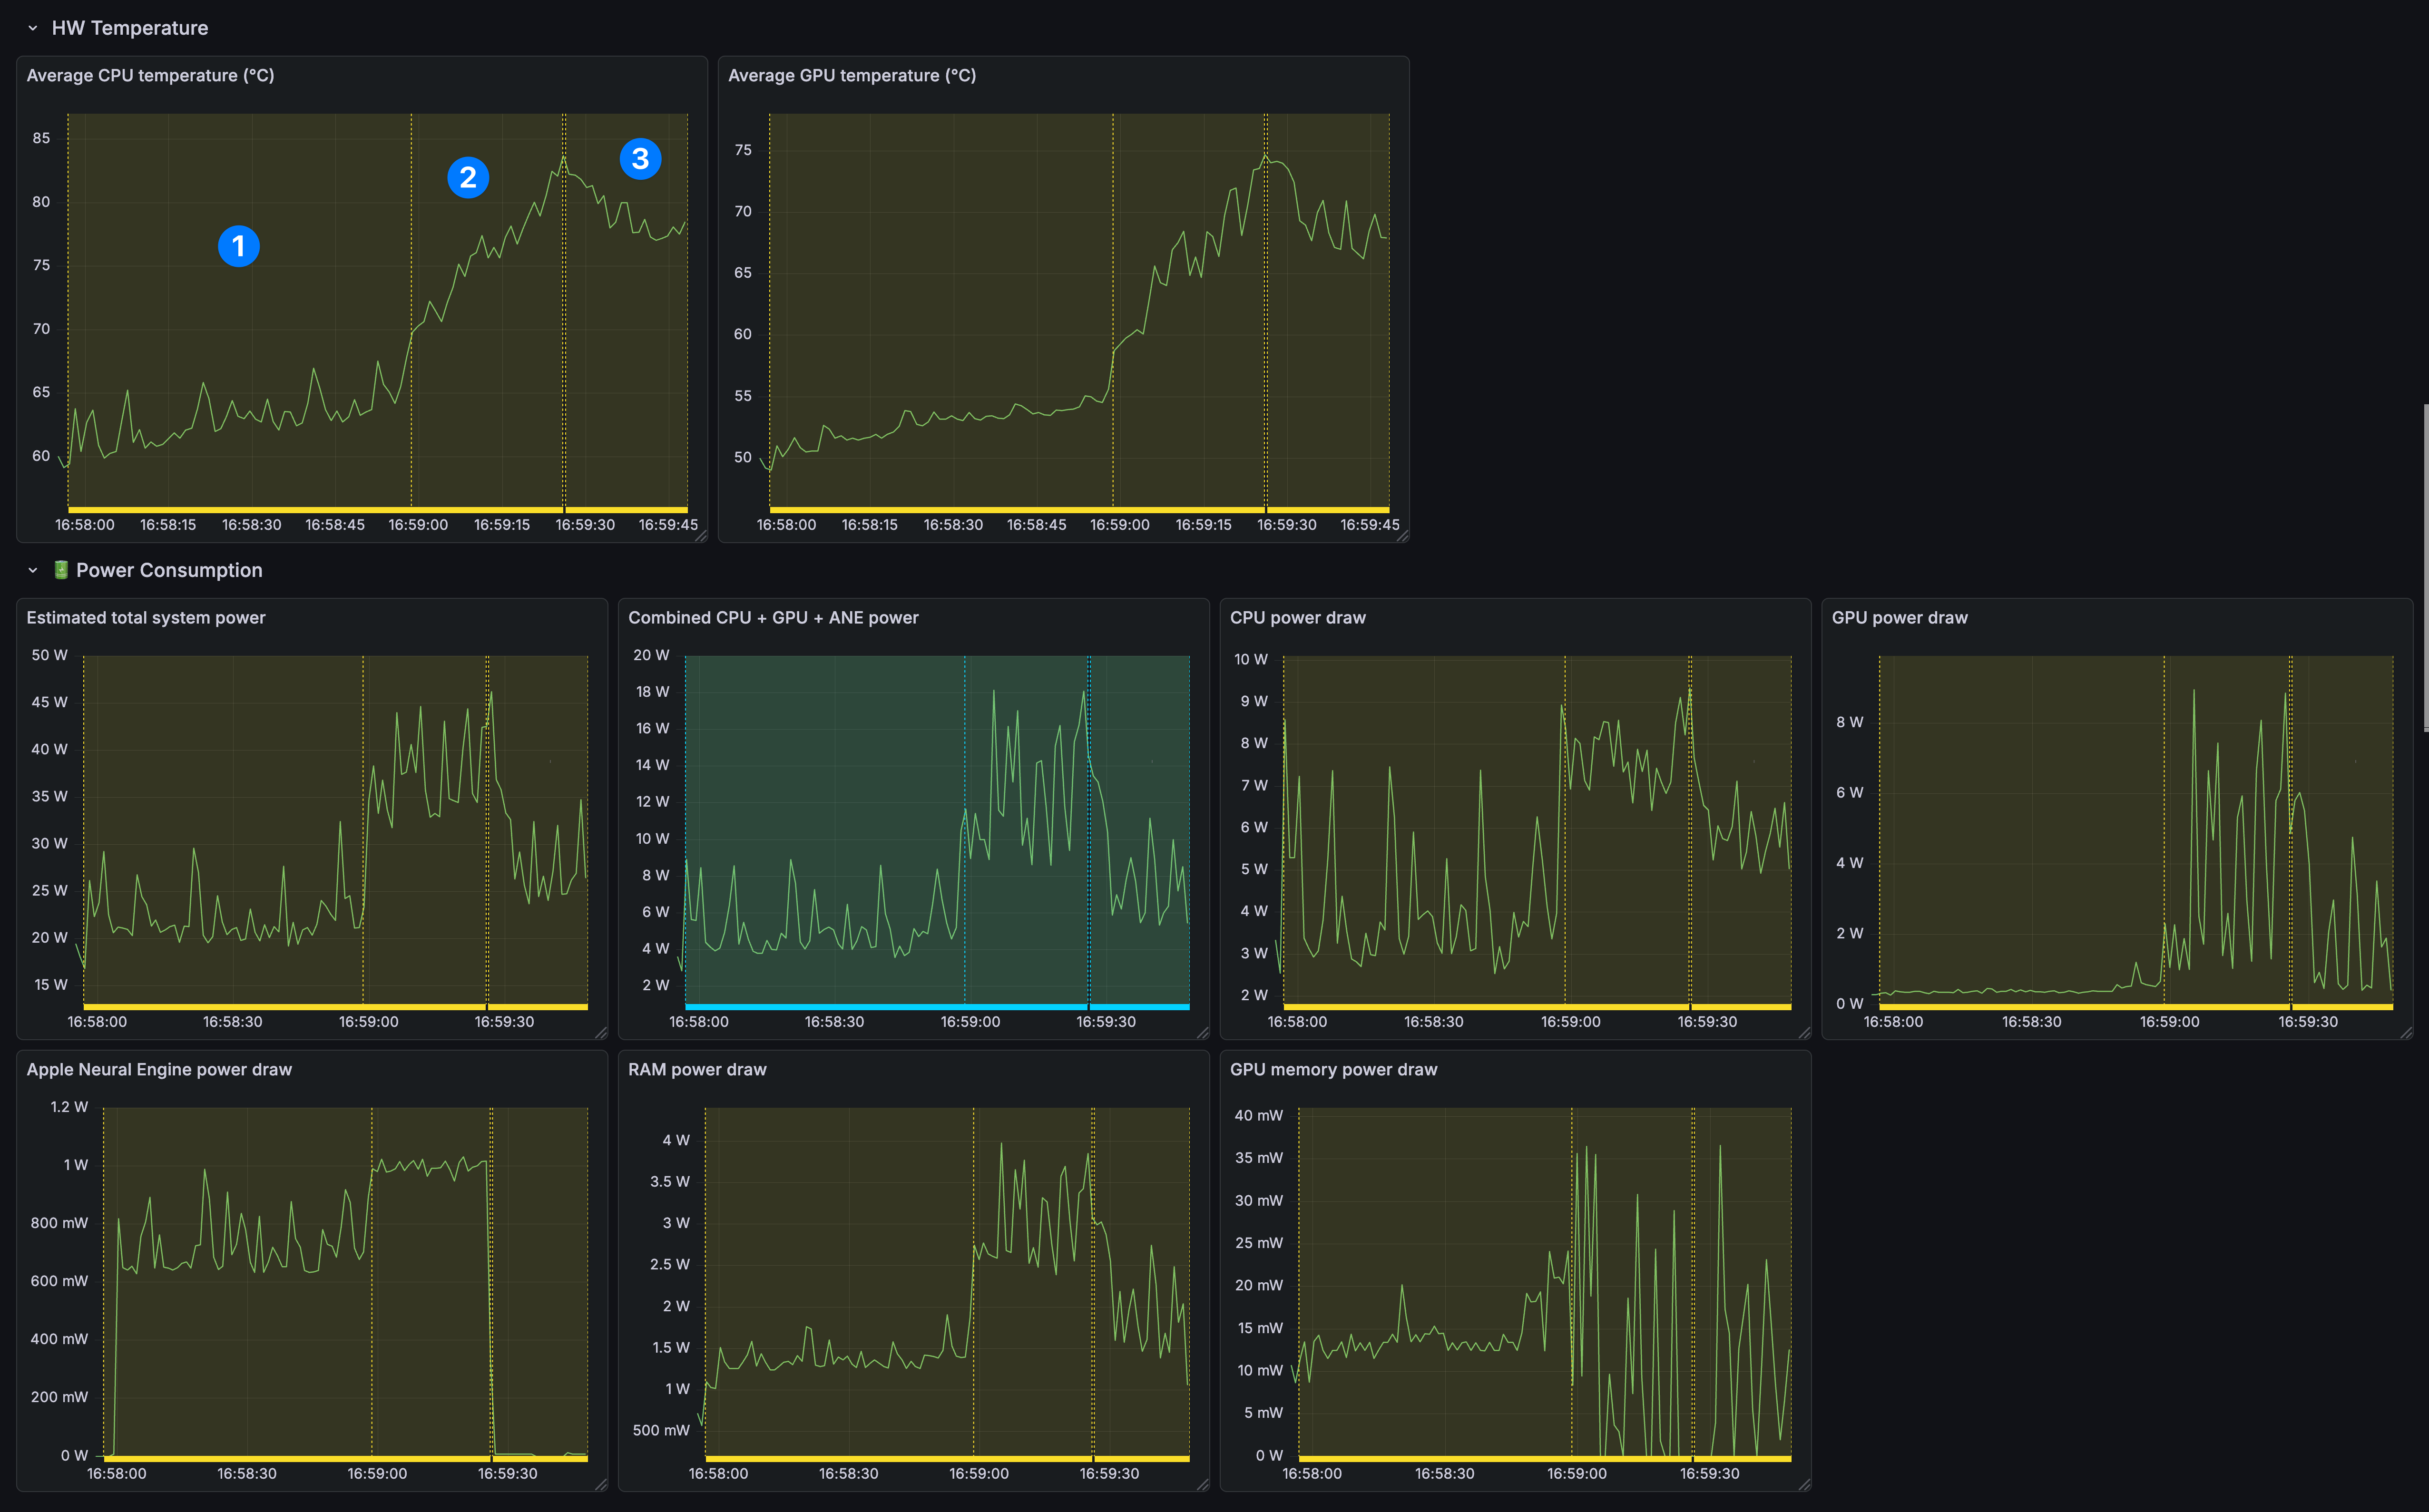
It turns out newer MacBooks use the Apple Neural Engine (ANE) when the camera is on, even with no effects applied (Studio Light, Portrait).
In annotation #2, screen sharing + camera on, CPU and GPU temperatures climbed steadily.
In annotation #3, after stopping the camera feed, temperatures started dropping, and ANE fell to near zero (0).
Testing with other apps and repo#
To sanity-check that we were not doing something weird in our code, I tested a few other apps (Google Meet, CleanShot X recording with camera). The same pattern showed up.
I do not have a clean workaround yet, but I hope a macOS update fixes it soon 🤞
If you want to try yourself this setup, we have an example repository here.
Ditch the frustrating "Can you see my screen?" dance.
Code side-by-side, remotely.
Conclusion#
Performance regressions are frustrating, especially when they stem from the OS. I hope this exploration helps you measure a real problem, get a clear graph, and avoid guessing.
We are building Hopp so you can explore issues with a work buddy, so go ahead and give Hopp a try!
If you have questions or want to compare notes on macOS performance debugging, reach out on X or email me at costa@gethopp.app.